London SODA
  • Home
  • Articles
  • About
  • Home
  • Articles
  • About
Search by typing & pressing enter

YOUR CART

ARTICLES

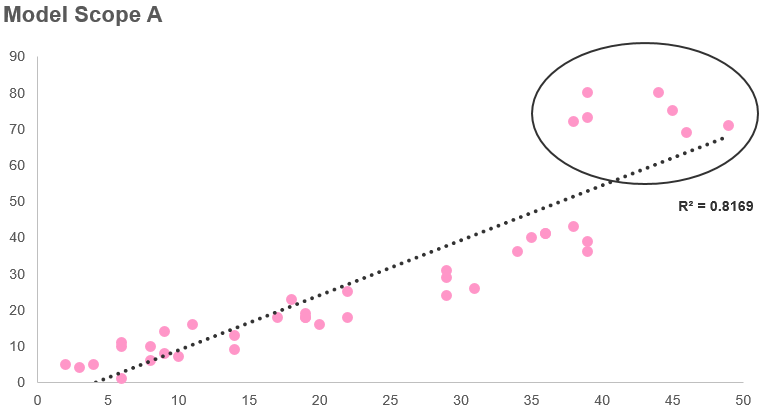
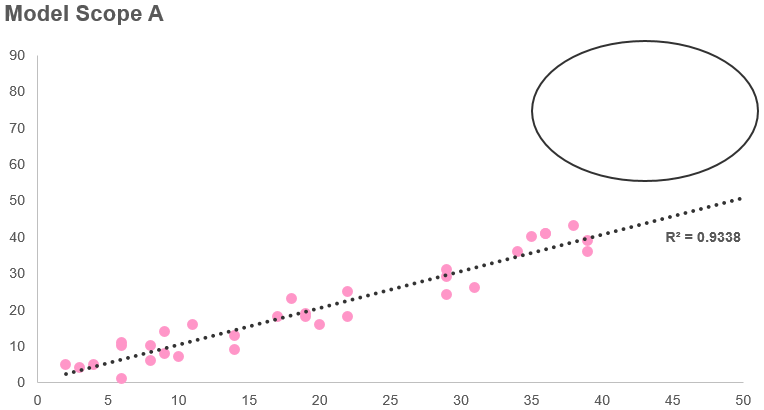
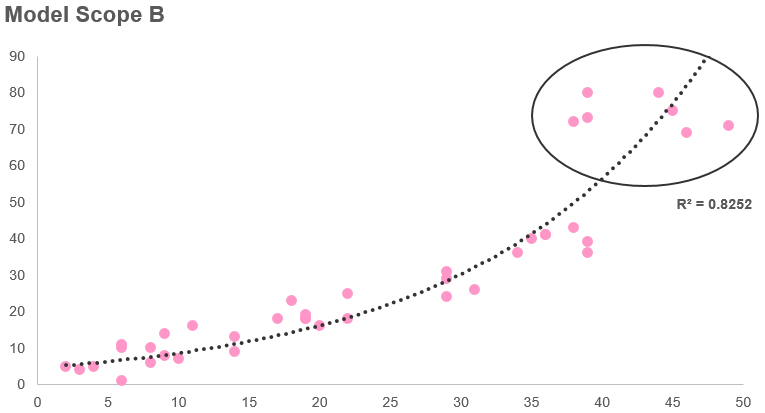
23/6/2019 0 Comments

Dealing with outliers


Introduction

At their best, outliers can help understand the scope and limitations of a model. At their worst, they create hidden fundamental flaws data sets that can skew models and muddy the waters of a model’s predictive power.
​

The method for dealing with outliers is often boiled down to ‘search and destroy’, which can lead to the loss of good data. But what if there was another way of dealing with outliers? What if you could use outliers to your advantage? What are outliers anyway?
Picture
What is an outlier

Although it is often common sense if a data point is an outlier, sometimes there are data points that lie at the margins and may or may not be outliers. In these instances, it is important to understand the essence of what outliers are and how they can be defined:
An outlier is a data point that falls outside the scope of a model or the description of a group.
For example:
  1. a 7ft tall human is an outlier because they fall outside of our typical description of the group ‘humans’, who are almost all between 4.5ft and 6.5ft
  2. the P/E ratio of Twitter would be an outlier for a model of P/E ratios for companies with revenue under $100m p.a., because Twitter would fall outside the scope of the model

This suggests that there is no such thing as a predetermined outlier.
​

A data point is an outlier depending on i) its relative characteristics compared to a group and ii) the scope of the model that is included in. If you change group or the scope of the model, a data point could cease to be an outlier.

For example:
  1. a 7ft tall human is not an outlier because they fall inside our typical description of the group ‘mammals’
  2. The P/E ratio of Twitter would not be an outlier for a model of P/E ratios for companies with revenue under $10b

Defining outliers is not usually this semantic, however it is important to spend time before and during analysis to think about how the definition of your outliers impacts the scope of the model and the subject matter being analysed or modelled.

How to spot outliers

By far the fastest and easiest way to spot potential outliers in a data set is through visualisation. It is best practice to visualise data in a variety of ways to spot data points that just don’t look right. Although this seems a bit unscientific to draw up some charts and assess the data by eye, it is a crucial first step in spotting potential outliers.

​Visualisation is typically the first thing people do when trying to understand a data set. This makes a lot of sense because human beings are built to see outliers. Take a look at the picture below and think how long it took you to spot the outlier!
Picture
Solving real world problems, there is another highly effective, and sometimes more thorough, method of finding outliers; speaking to people!

In practice, data sets have owners who can reveal additional and hidden characteristics of the data set that cannot be detected through visualisation. For example, when working with a SaaS business on a customer analysis project, I asked the CFO about what they would expect to find in the data set. She told me that certain large and overseas customers have a completely different price plan than normal customers and that these customers would have a significantly lower £/employee ratio. Having this conversation meant that these customers could be excluded from the main analysis and modelled separately without skewing the general population.

Without this conversation, this information would not have been picked up by a visualisation and the model would not have taken into account the divergent price plans.

Asking questions like ‘what trends would you expect to find?’, ‘do you make any manual adjustments to the data set?’ and ‘are there any one-offs in this data?’ can help get a better understanding of a data set and help define outliers.

Dealing with outliers

Once you have defined and identified outliers, the next step is dealing with them. In general, there are three common  methods of dealing with outliers:
  1. Exclude outliers by specific instances - e.g. excluding shop x from a model of retail park footfall because you know it is closing down;​
  2. Exclude outliers by thresholds - e.g. excluding times between 2100 and 0700 when modelling retail park footfall; and
  3. Change the scope of the model or the definition of the group you are trying to model, as outlined above.
The main disadvantage of method 1) and 2) is you sometimes exclude valuable data. For example, you are creating a model for predicting

​For method 3), this is a subjective process and the pros and cons are contextual. To illustrate this, the chart below sets out some data points with some potential outliers and a linear line of best fit:
Picture
The decision is whether to a) exclude these outliers and improve the model's accuracy. These data points will be lost and the model’s breadth of predicting power will be reduced:
Picture
OR b) include the data points and change the scope of the model, which may reduce the accuracy of the model (vs. simply deleting the outliers) but will broaden the predictive power of the model:
Picture
To preserve this valuable data, there is a less commonly used fourth method for dealing with outliers: imputation.

Imputation is the method of replacing data with substitute data. Often used to fill in missing data, imputation can also be used to replace outliers. The benefit of imputation is that valuable data can be kept in the model to improve its accuracy.


​With the example of modelling footfall in a retail park, if one of the shops were closed for refurbishment 3 months of the year it would be an outlier. An easy way to prevent this outlier from skewing the data set would be to exclude it. An alternative approach could be to impute data from the same 3 months of the previous year, +/- a growth rate. This way you could retain the 9 good months and have a fair substitute for the outlier 3 months.

Summary

At their best Outliers are subjective and depend on i) the definition of the group that the data point belongs to and ii) the scope of the model that the data points are being used in. 

The quickest way of spotting outliers is through visualisation and looking at which data points stand out or if there are any unusual visual patterns in the data. Speaking to people is another effective way of finding outliers, and can even identify hidden outliers that could not be found by analytically or visually interrogating the data.

Dealing with outliers can be very straightforward, e.g. simply deleting the outlier, or more complicated if using imputation to substitute the outlier using other data.


0 Comments


Leave a Reply.

    Author

    London SODA

    View my profile on LinkedIn

    Archives

    February 2020
    October 2019
    August 2019
    June 2019
    April 2019

    Categories

    All

    RSS Feed

    Sign up for more LONDONSODA

Sign up